
Dear Christian,
We've been using your experimental locking to improve performance of BaseX in our application. It definitely helps, but right behind this bottleneck is file-io blocking. i'd like to get a deeper understanding of how your file-io is organized and what your caching scheme looks like. What sort of file-io caching mechanism is in place now? What are your plans? Is there anything we can do to help that along?
Best wishes,
--greg
---------- Forwarded message ---------- From: Jason Klassen Jason.Klassen@protegra.com Date: Tue, Jan 22, 2013 at 9:35 AM Subject: BaseX Performance Test - hitting a performance wall ...
I’ve run the performance tests with 7.5.1 servers using DB Locking and with varying levels of parallel reads. *Unfortunately there is no performance gain*. While the socket.io blocking is gone the disk io blocking right after impacts performance just as much. Results are:****
** **
previous (8 reads)****
32 reads****
64 reads****
192 reads****
first****
last****
first****
last****
first****
Last****
first****
last****
UAT 10 by 1000****
8.76****
14.16****
8.79****
12.99****
9.12****
12.73****
8.4****
12.9****
** **
Running with 192 reads and causing 10 by 10 by 1000, 10 users by 10 concurrent searches on 300ms delay each, by an affiliate with 1000. (above is 10 users by 1 concurrent search by an affiliate with 1000)****
** **
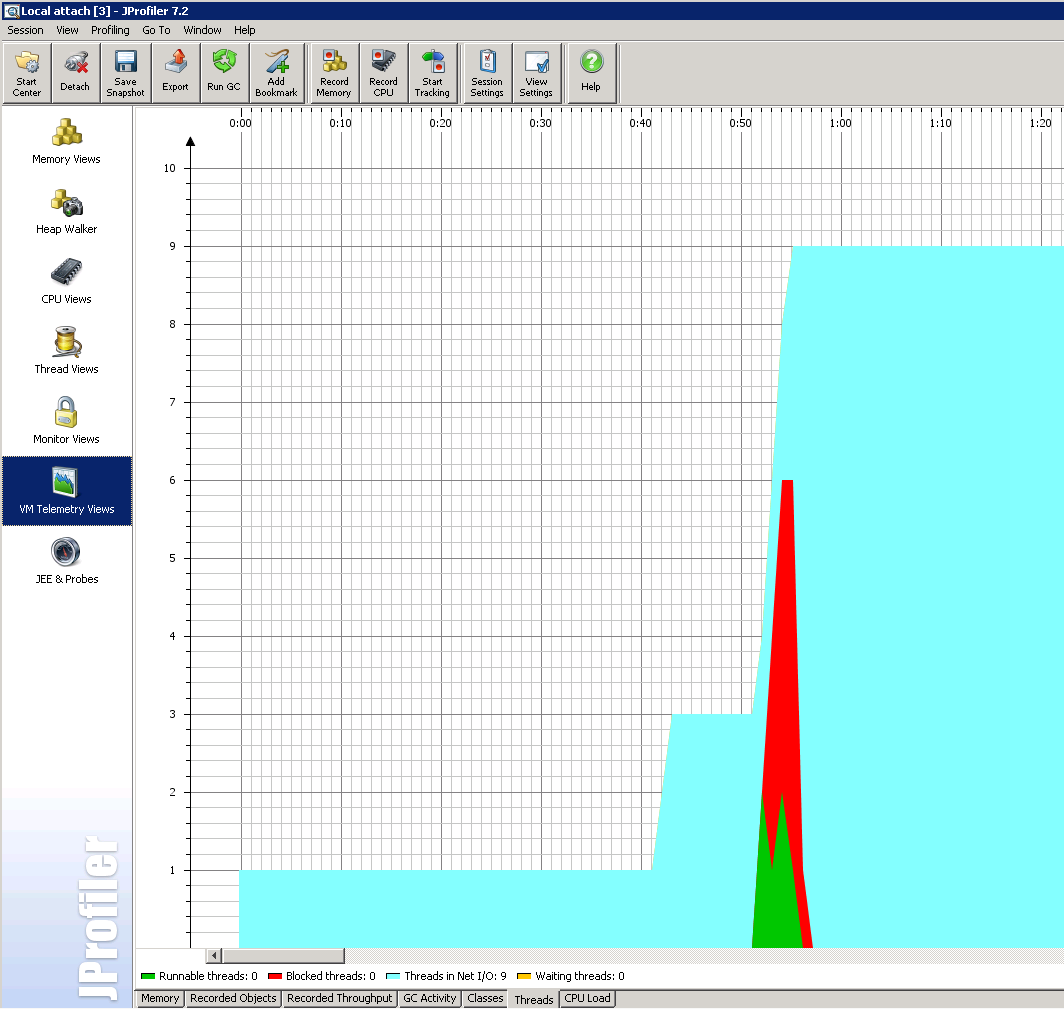
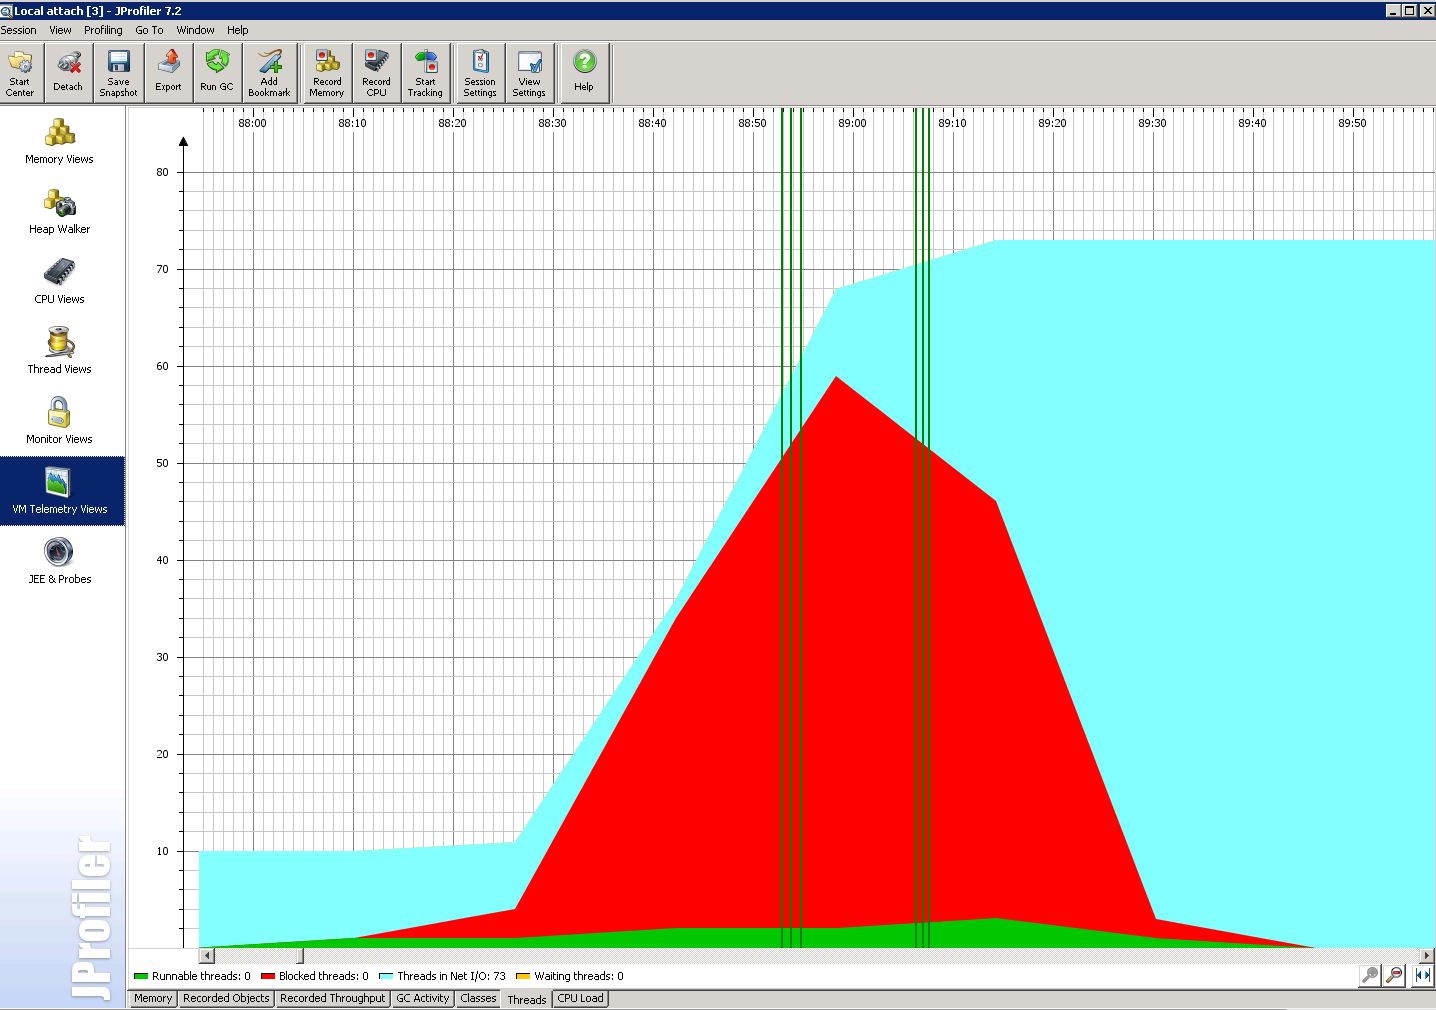
I’ve attached some screenshots showing what the basex jar is doing when the tests run. It seems only ~1-2 threads can read from disk at any given time. The red sections are all 3 common issues, TableDiskAccess.read1, TableDiskAccess.read2, DataAccess.readToken, the dumps are attached as well. ** **
** **
Looking at the source for basex TableDiskAccesshttps://github.com/BaseXdb/basex/blob/master/src/main/java/org/basex/io/random/TableDiskAccess.java and DataAccesshttps://github.com/BaseXdb/basex/blob/master/src/main/java/org/basex/io/random/DataAccess.javathere is no file system caching. Every test is doing a buffer read on the exact same database even though it does not change from a write. So instead of basex realizing this, it just blindly goes to the disk each time. ****
** **
We’ll run some tests on a vm backed by ssd to see if that can resolve the disk access*. If it can’t, and without any kind of caching logic, this looks to be as far as we can go with basex performance and I’m not sure it will be enough.* Even if caching logic existed for read, I’m still concerned that many writes with basex will block it the same way as it doesn’t appear to do any log or page caching as most relational dbs do now to limit disk io impacts. Sharding the dbs across 16 servers would have helped for socket.io but it will not solve physical disk io. ****
** **
Jason****
** **
*From:* Sasa Ivetic *Sent:* January-18-13 3:05 PM *...*
** **
Hi everyone,****
** **
I’ve spent a few hours today writing a simple BaseX test (mimics the BaseXPersistTest in KVDB) in order to analyze performance of different machines we have available to us. Results are interesting, and demonstrate that the test is likely heavily I/O bound on our Production server hosted by Rackforce. I’ve attached two quick graphs I made from the results. “BaseX Test Results Chart.png” is a graph of total runtime based on specified parameters, with Y Axis being measured in ms (lower is better). “BaseX Test Results Chart – Queries Per Second” is a graph of total queries per second (higher is better).****
** **
PARALLEL parameter is a BaseX Server setting indicating how many read/write processes can run concurrently****
T parameter is the number of client threads used to create read/write requests****
QPT parameter is the number of queries each thread runs****
** **
Amazon EC2 is the High I/O instance, with 16 cores, and 1TB worth of SSD-backed storage****
My laptop is a Core i7 (4 cores w/ HT) with a 7200rpm drive****
Beta is our own internal VM****
Prod is the Rackforce VM, in their high performance cloud and with the high performance SAN (which we’re pretty sure is SSD backed as well) ****
** **
For purposes of the above test, 5% of total queries were write queries. On average, each test executed just under 19k read queries and just over 1k write queries (for a total of 20k queries). The test is only a micro-benchmark, but I feel it reflects daily Protunity usage reasonably well.****
** **
I will also try to spend some time testing raw I/O throughput (and more importantly) latency with third-party software to get a better grasp of the differences between the various servers.****
** **
** **
_________________****
Sasa Ivetic****
204-488-5697****
** **